Reading process variation: signal, noise and superstition
Superstition is a belief held without reason or knowledge, and it has no business in the running of a plant. Yet it is what you get whenever a number is compared to a budget figure, or to the same month last year, and a conclusion is drawn. That comparison asks nothing of the data. It cannot distinguish a process that has genuinely changed from one that is doing exactly what it has always done.
The distinction matters commercially. If variation is routine — common causes, the process at equilibrium — then investigating any individual month is wasted effort, and the report you demanded from the operations manager is a tax on everybody's time. If there is an assignable cause producing excessive variation, you have an unpredictable process, and the tell is that people start describing it with words like skill, art and knack. Those words are a symptom of absent knowledge.
This is not a manufacturing-only problem. It applies to sales, to P&L management, to safety statistics, to anything measured repeatedly over time.
A worked example
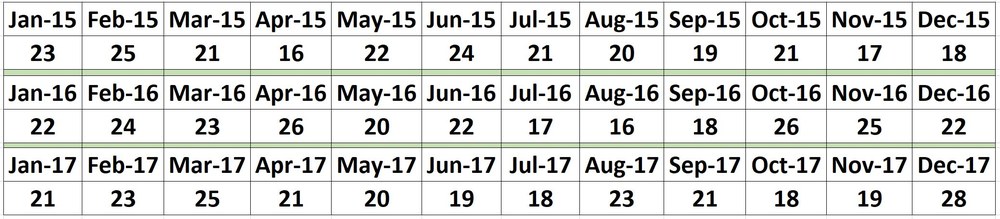
Here is monthly work-in-progress inventory. The budget says the average should be 18.5. December came in at 28 — well above plan, and above the 22 recorded the previous December. Year-to-date average is 21.3, also above plan. On the conventional reading, three separate things are wrong and somebody owes an explanation.
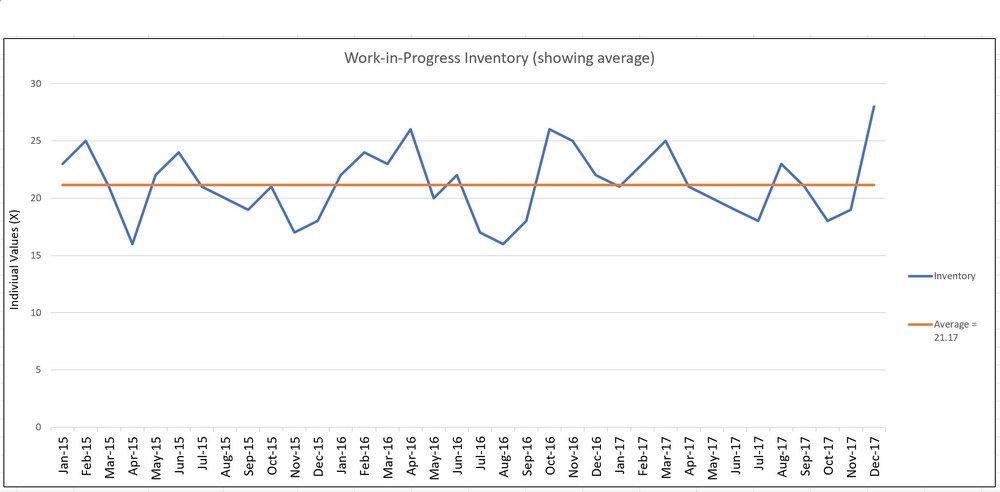
Plotting the series with its average (21.17) adds nothing. Some good months, some bad months, no discernible trend. Bouncy data, and superstition.
The moving range
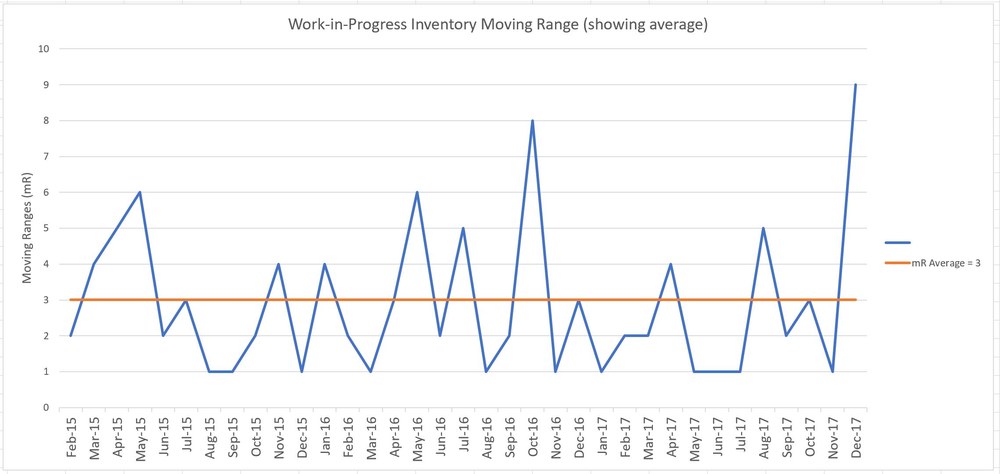
To find out whether something actually changed in December, look at month-to-month movement: the absolute difference between successive values, plotted with its own average, which is 2.9 and rounds to 3 for the calculations below.
The limits, and where they come from
Two calculations. The upper range limit is the average moving range multiplied by 3.27. At an average mR of 3, that is 9.81.
The natural process limits come from the average moving range multiplied by 2.66, added to and subtracted from the average of the individual values. Here: 21.17 + (2.66 × 3) = 29.15 upper, and 21.17 − (2.66 × 3) = 13.19 lower.
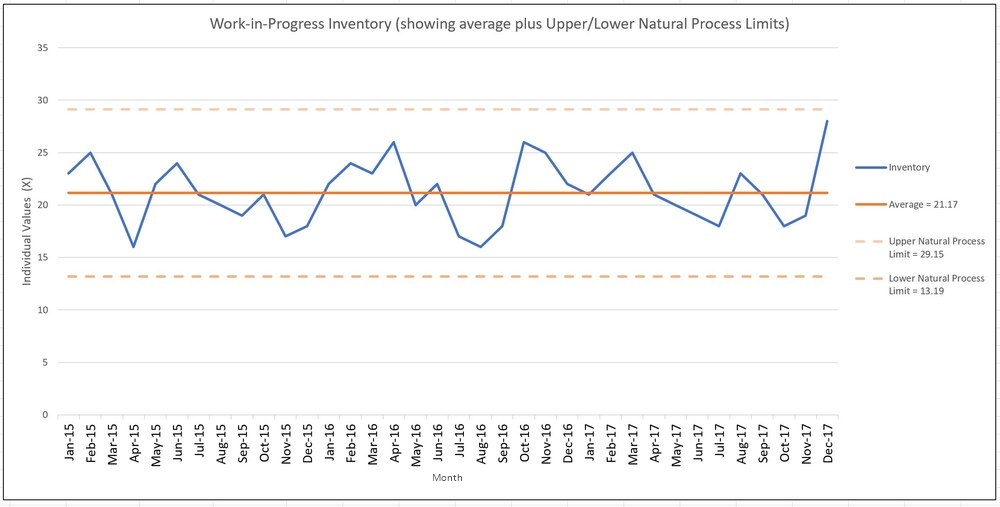
The critical point is what these limits are not. They are a property of the process. They have nothing to do with your customer specification, your budget number, your KPI or your target. If the natural limits sit outside the budget figure, that tells you the budget was set without reference to what the process is capable of producing. You can have a nominally six-sigma process that is nonetheless a bad process, varying comfortably within very wide limits.
What the charts actually say
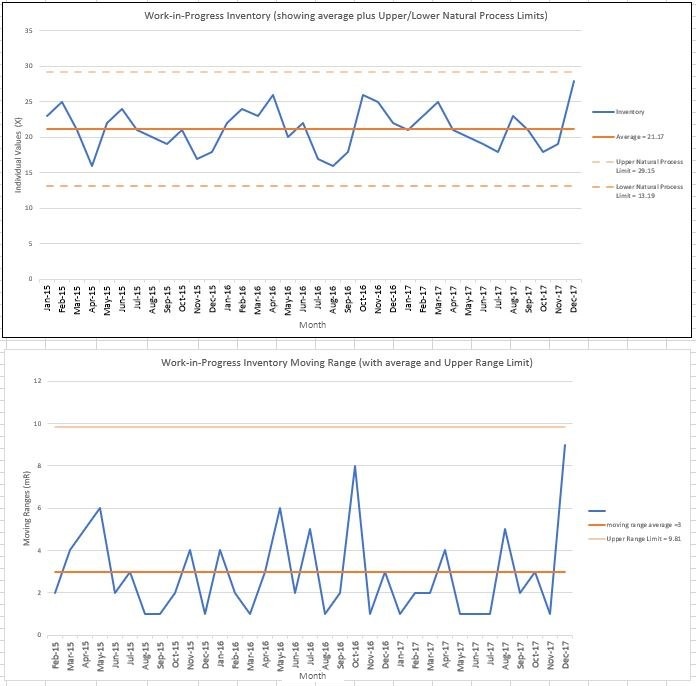
December's value of 28 does not exceed the upper natural process limit of 29.15. It is therefore not a signal. There is nothing in particular to explain, and looking for an explanation will waste everyone's time and probably produce a fictional one. The moving range chart agrees: no special cause.
Further, any WIP figure between 13.19 and 29.15 is entirely consistent with what this process delivers. You may make a rule that WIP shall be between 18 and 22. The process will continue to do what it has always done and cheerfully ignore your rule — unless you change the process, or somebody starts adjusting the numbers, which is the usual outcome when a rule is enforced against a process that cannot meet it.
The point
You now have a choice you did not have before. You can accept what the data says — the limits are wide, and if you dislike them you must change the process that produces them. Or you can take the superstitious route, blame the operations manager for December, and demand that something be done.
Only one of those improves the plant.
This is the sort of analysis I run before recommending any hardware change during an operational and process engineering review.